
Stock Chart provide Technical Charts Analysis for forecasting stock, index of future price. Stock Chart 提供技術圖表分析工具,協助用家以估計股票或指數未來趨勢。
What is Stock Chart v2?
Stock Chart v2 is a accessibility chrome extension. it's a free extension and is featured in Accessibility, it has 288 active users since released its first version, it earns an average rating of 5.00 from 1 rated user, last update is 2043 days ago.
What’s new in version 1.0?
互動圖表
Stock Chart provide Technical Charts Analysis for forecasting stock, index of future price. Stock Chart 提供技術圖表分析工具,協助用家以估計股票或指數未來趨勢。
Real time Stock/Future/Index Technical Charts Analysis.
即時股票/期貨/指數的技術圖表分析工具
Function:
Drawing Tools
Real time price
Take Photo for your Chart
News of the Stock
功能:
畫圖工具
即時價位
輸出畫圖後的圖表
股票新聞
即月期 代號 HK50
HSI 代號 HONG KONG:HK50
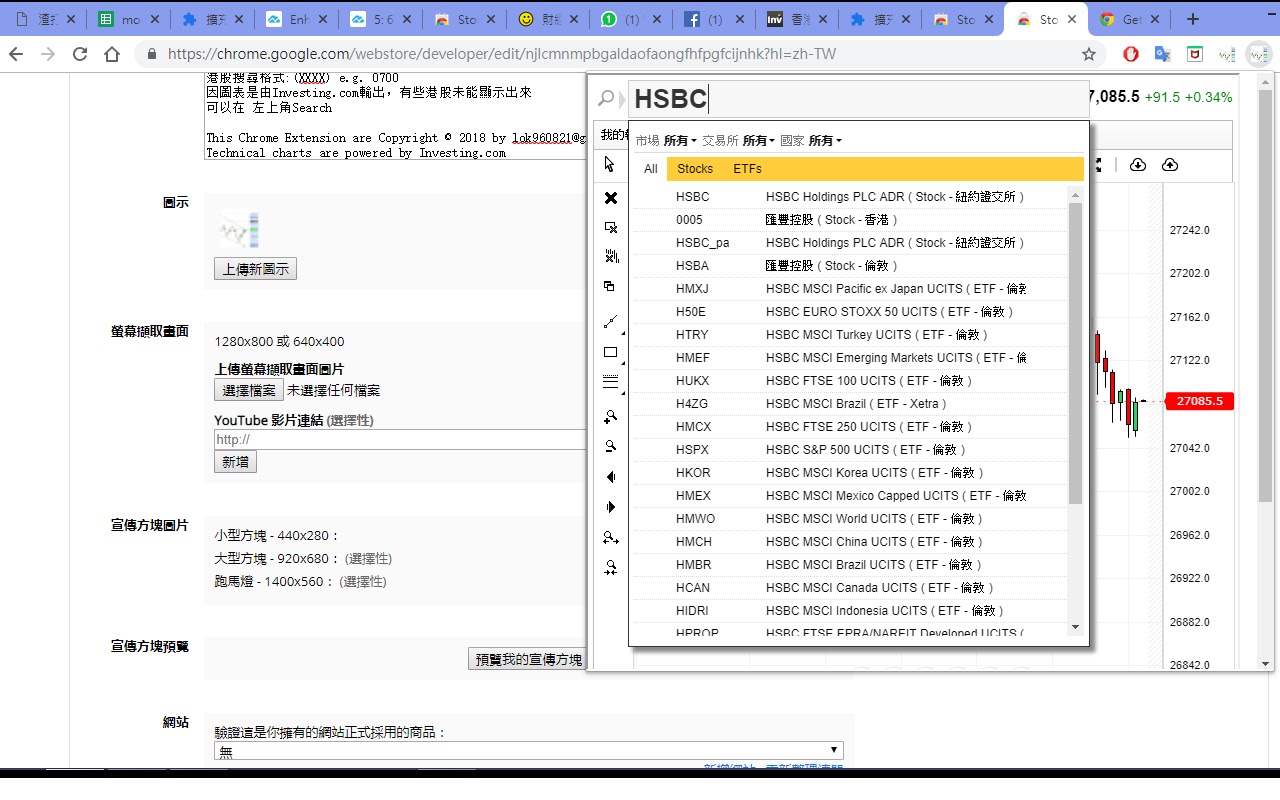
港股搜尋格式:(XXXX) e.g. 0700
因圖表是由Investing.com輸出,有些港股未能顯示出來
可以在 左上角Search
This Chrome Extension are Copyright © 2018 by [email protected]
Technical charts are powered by Investing.com
How to install Stock Chart v2?
You could download the latest version crx file or older version files and install it.
Preview of Stock Chart v2


Technical Features:
- Latest Version: 1.0
- Requirements: Windows Chrome, Mac Chrome
- License: Free
- Latest update: Wednesday, October 3rd, 2018
- Author: lok960821
Stock Chart v2 Available languages:
中文 (繁體).
FAQ
-
How could i get help if there is something wrong with stock chart v2 chrome extension?
You could find more help information from stock chart v2 support page.
-
How could i contact the developer of stock chart v2 chrome extension?
You could send emails to publisher, or check publisher's website.
-
How could i report abuse of stock chart v2 chrome extension?
You could click to report abuse of stock chart v2.