
Debug Node in Chrome devtools
What is Node Debugger?
Node Debugger is a web development extension for chrome. it's a free extension , it has 1,000+ active users since released its first version, it earns an average rating of 5.00 from 3 rated user, last update is 2729 days ago.
What’s new in version 0.6.0?
                Connect to v8 inspector debugging instances! This extension allows you to save configured debugging sessions and will automatically check them for availability on startup.

To quickly get started you can do the following:
 - Start a node 6.3+ process with the --inspect flag set (this will start a debugging session at localhost:9229)
 - Click on the extension icon in Chrome and see that the Default session is available.
 - Click on the Default session and a new Chrome window will load with the devtools connected to node.
 - Carry on making great apps!

Roadmap ahead:
 - Attempt to detect when the debugger goes offline (this happens frequently in development with Nodemon) and attempt to reconnect automatically
How to install Node Debugger?
You could download the latest version crx file or older version files and install it.
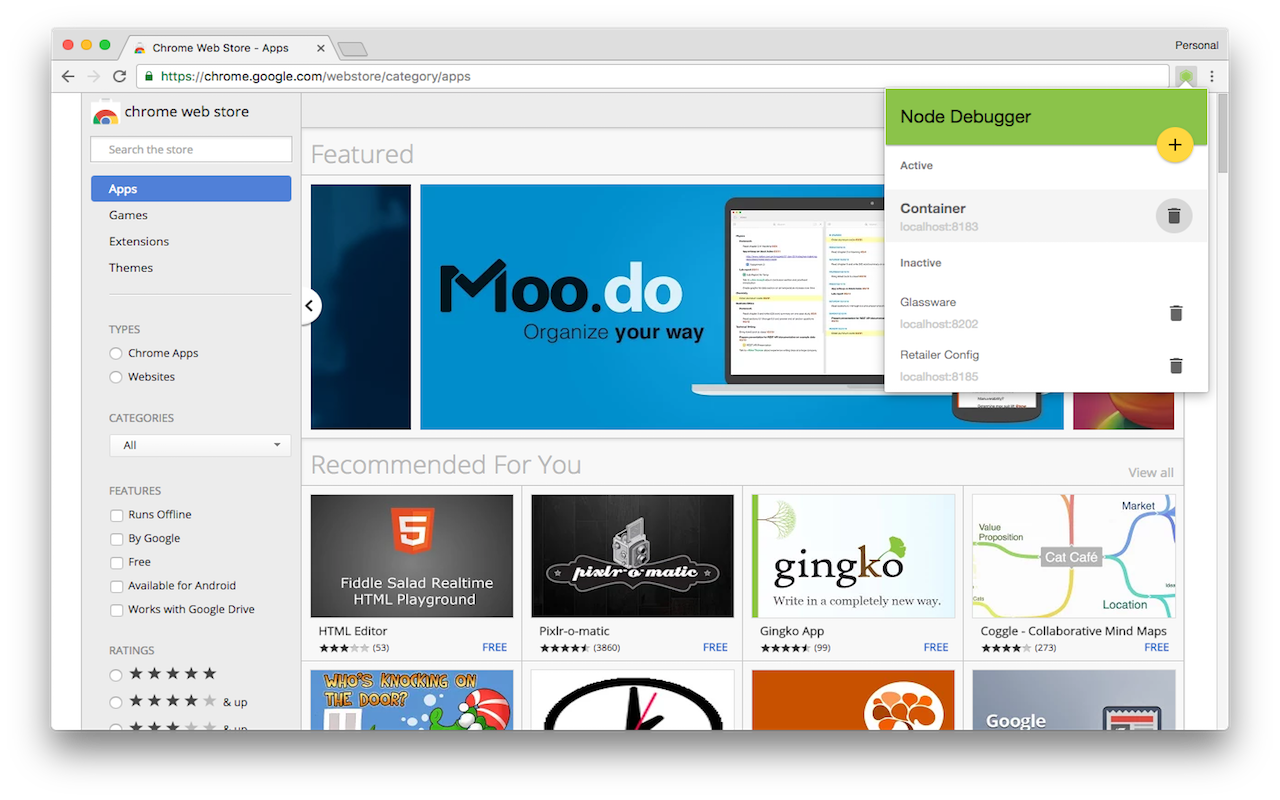
Preview of Node Debugger

Technical Features:
- Latest Version: 0.6.0
- Requirements: Windows Chrome, Mac Chrome
- License: Free
- Latest update: Friday, October 28th, 2016
- Author: Apt-2531
Node Debugger Available languages:
English (United States).
FAQ
-
What about others talk about node debugger chrome extension?
100% user give 5-star rating. Read reviews of node debugger
-
How could i get help if there is something wrong with node debugger chrome extension?
You could find more help information from node debugger support page.
-
How could i contact the developer of node debugger chrome extension?
You could send emails to publisher, or check publisher's website.
-
What are the required permissions for extensions?
- activeTab
- tabs
- http://*/
- https://*/
- storage
More about manifest_file of node debugger.
-
How could i report abuse of node debugger chrome extension?
You could click to report abuse of node debugger.
Reviews of node debugger:
Tony Ko
July 14th, 2017

The only one that really works, with a nice interface as well.