
What is FortiManager/FortiAnalyzer Debugger?
FortiManager/FortiAnalyzer Debugger is a developer tools chrome extension. it's a free extension , it has 1,000+ active users since released its first version, it earns an average rating of 5.00 from 6 rated user, last update is 1087 days ago.
What’s new in version 1.0.2?
This extension allows for capturing detailed debug information of a FortiManager/FortiAnalyzer's graphical user interface. Requires FortiManager/FortiAnalyzer 6.4.0 GA or greater.
How to use this tool:
1. For capturing:
a. Login any FortiManager/FortiAnalyzer that is latter than 6.4.0 GA, this extension color will turn blue (activated).
b. Click this extension and select "New Capture"
c. update the file name and select "Start Capture"
d. FortiManager/FortiAnalyzer should prompt for permission, select "OK" to start capture debug information.
e. A red record icon appears in the FortiManager/FortiAnalyzer toolbar.
f. After finishing your operation, click the record icon to stop and download the captured zip file.
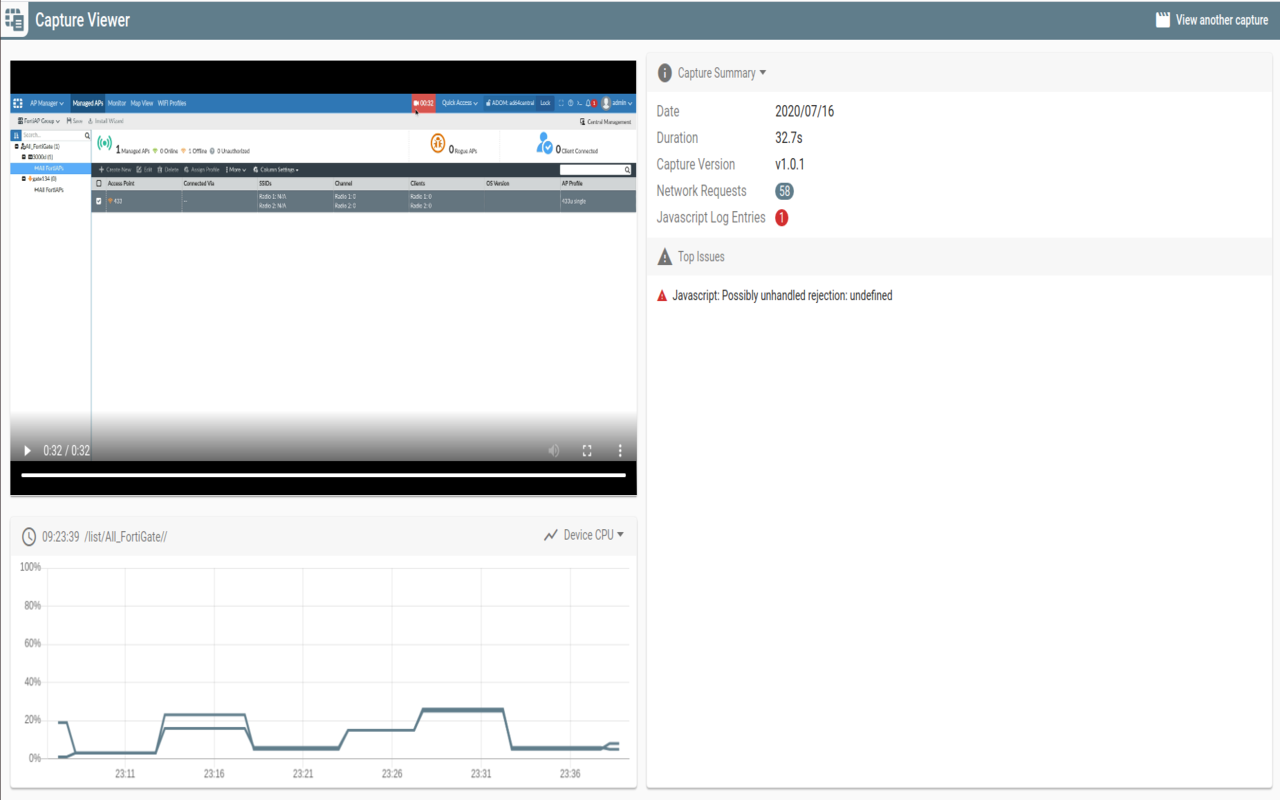
2. For viewing:
a. Open this extension and select "View Existing Capture".
b. Open the captured zip file in the newly open viewer tab.
c. Start the video to view the operation and different captured information.
How to install FortiManager/FortiAnalyzer Debugger?
You could download the latest version crx file or older version files and install it.
Preview of FortiManager/FortiAnalyzer Debugger
Technical Features:
- Latest Version: 1.0.2
- Requirements: Windows Chrome, Mac Chrome
- License: Free
- Latest update: Friday, May 7th, 2021
- Author: Fortinet
FortiManager/FortiAnalyzer Debugger Available languages:
English (United States).
FAQ
-
What about others talk about fortimanager/fortianalyzer debugger chrome extension?
100% user give 5-star rating. Read reviews of fortimanager/fortianalyzer debugger
-
How could i get help if there is something wrong with fortimanager/fortianalyzer debugger chrome extension?
You could find more help information from fortimanager/fortianalyzer debugger support page.
-
How could i contact the developer of fortimanager/fortianalyzer debugger chrome extension?
You could send emails to publisher, or check publisher's website.
-
What privacy data fortimanager/fortianalyzer debugger chrome extension collect?
- User activity
- Website content
-
What are the required permissions for extensions?
- management
- system.cpu
- system.memory
- tabCapture
- <all_urls>
- downloads
More about manifest_file of fortimanager/fortianalyzer debugger.
-
How could i report abuse of fortimanager/fortianalyzer debugger chrome extension?
You could click to report abuse of fortimanager/fortianalyzer debugger.
Reviews of fortimanager/fortianalyzer debugger:

Great tool. I found it really helpful to identify API calls.

Excelent tool

This tool is very useful for more efficient communication between customer and development teams. The tool not only records a video showing the problem and how to repeat the issue, but collects API request and response details for R*D team for further troubleshooting.