
What is Stock Checkup Flaw Counter?
Stock Checkup Flaw Counter is a productivity chrome extension. it's a free extension , it has 453 active users since released its first version, it earns an average rating of 5.00 from 7 rated user, last update is 470 days ago.
What’s new in version 1.30?
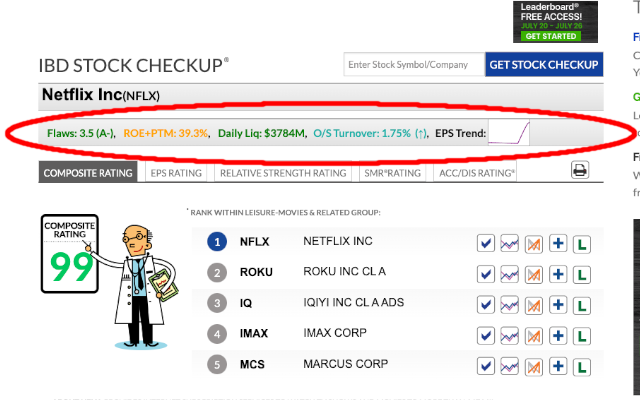
                Save time when trying to count Stock Checkup flaws on investors.com.  This extension counts the flaws (according to common IBD Meetup rules) and assigns a letter grade.  Also calculates ROE (return on equity) plus PTM (pre-tax margin), and calculates the average daily liquidity (average daily dollar volume proxy).  Put your calculator and notepad away!

NEW: Calculates share turnover % (50-day Avg Volume / shares available).  On /stock-checkup page, shows turnover of shares outstanding. On /stock-quotes page, also shows turnover of float.  The arrow next to Turnover on the /stock-checkup page shows the Up/Down Volume ratio

Also adds a rudimentary EPS trend chart, so you can see at a glance if earnings may be decelerating.

For more info on these scoring tools, please visit the Petaluma Investor's Business Daily Meetup site: https://sites.google.com/view/petalumaibdmeetup

This tool is for educational purposes only, and not intended to recommend any security.  Use at your own risk!  We are not responsible for errors or omissions.  This is not to be construed as investment advice, and we are not investment advisors.

Browser extension development is supported by user donations.  If you find this extension useful, please consider sending a commensurate donation to support our developers, via this url:  https://www.paypal.com/donate?hosted_button_id=VYB6ZVDTU4KEG


FAQ:
1) "Why is the EPS Trend chart blank for some stocks?"

Good question.  The answer is that some stocks have an "N/A" for either 3Yr EPS, 3Qtr EPS or last EPS. Without 3Y, 3Q, & 1Q, no trend can be drawn.  If the EPS Trend chart is blank, that means not enough data are available to determine a trend.

If you see a very small gap at the righthand end of the chart, that means there is no current estimate.
How to install Stock Checkup Flaw Counter?
You could download the latest version crx file or older version files and install it.
Preview of Stock Checkup Flaw Counter

Technical Features:
- Latest Version: 1.30
- Requirements: Windows Chrome, Mac Chrome
- License: Free
- Latest update: Thursday, January 19th, 2023
- Author: CrystalBull
Stock Checkup Flaw Counter Available languages:
English.
FAQ
-
What about others talk about stock checkup flaw counter chrome extension?
100% user give 5-star rating. Read reviews of stock checkup flaw counter
-
How could i get help if there is something wrong with stock checkup flaw counter chrome extension?
You could find more help information from stock checkup flaw counter support page.
-
How could i contact the developer of stock checkup flaw counter chrome extension?
You could send emails to publisher, or check publisher's website.
-
What are the required permissions for extensions?
- *://*.investors.com/
More about manifest_file of stock checkup flaw counter.
-
How could i report abuse of stock checkup flaw counter chrome extension?
You could click to report abuse of stock checkup flaw counter.
Reviews of stock checkup flaw counter:

Great tool and time saver if you use the IBD stock checkup tool and utilize Lee Tanner's A thru E grading system

Cannot agree more with the other reviewers. If you want to use investors.com this does a marvelous job of giving a "at a glance" grade that incorporates and weights all the factors in the Stock Checkup function. Great time saver when used in conjunction with the Petaluma IBD Group video on how to build a watch list.
A very handy tool to put in the tool box. A time saver