
Debug the head section of any webpage in a comfortable way.
What is Meta Debugger?
Meta Debugger is a developer tools chrome extension. it's a free extension and is featured in Developer Tools, it has 1,000+ active users since released its first version, it earns an average rating of 4.88 from 8 rated user, last update is 1975 days ago.
What’s new in version 0.7?
This Chrome extension was made to simplify the daily work with webpage meta data (head contents) like titles, canonicals, Open Graph data, icons and many more things.
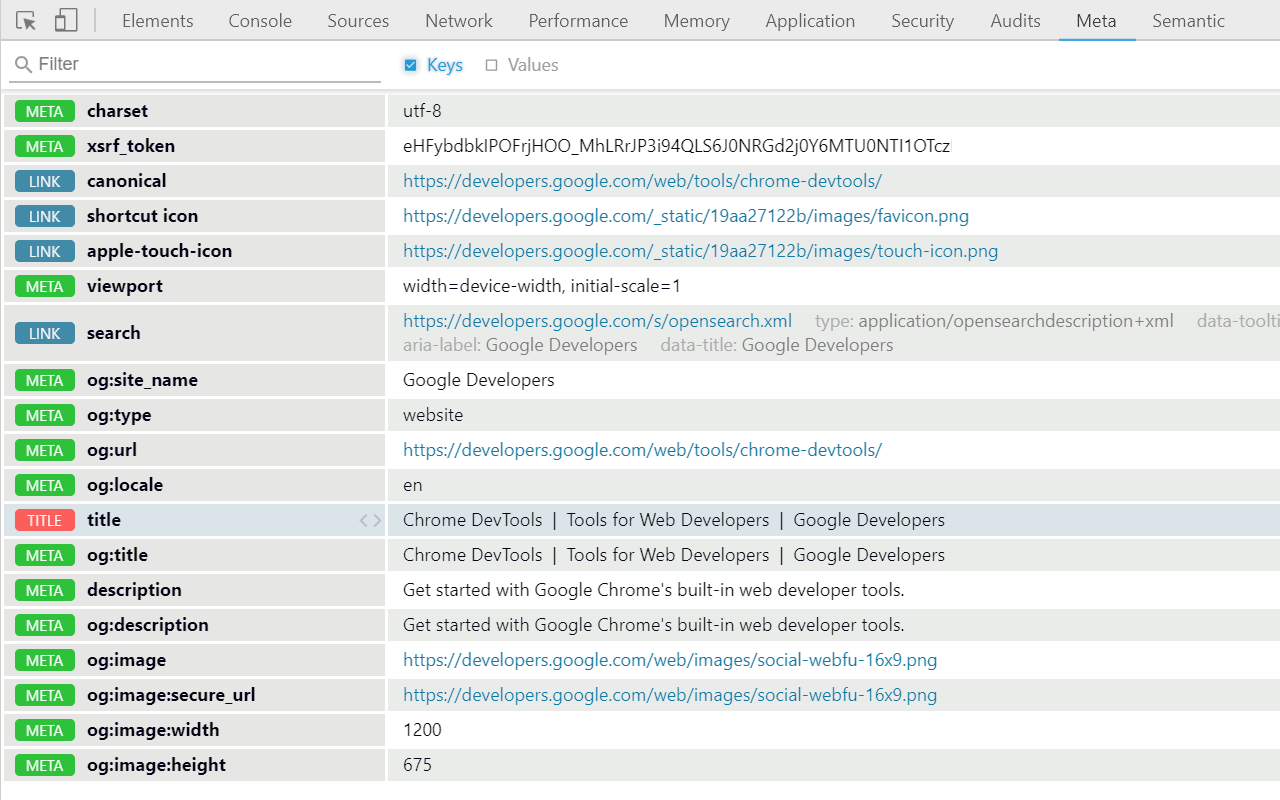
It will add another panel to your Chrome DevTools and allow you to see all information at a glance, nicely grouped and in real time.
- Results are displayed in their source code order
- The result list is always kept up-to-date. When (for whatever reason) it seems stucked, you may press the reload button located at the upper right.
- The filter can be easily used by starting typing (the input doesn't need to be focused before)
- You can filter by multiple arguments if you use `,` as delimiter (e.g. "title, canonical")
- To show up result options/actions simply hover its row
If you find some bugs please report them via Github:
https://github.com/bluemoehre/chrome-meta-debugger
Thanks!
How to install Meta Debugger?
You could download the latest version crx file or older version files and install it.
Preview of Meta Debugger


Technical Features:
- Latest Version: 0.7
- Requirements: Windows Chrome, Mac Chrome
- License: Free
- Latest update: Thursday, December 20th, 2018
- Author: bluemoehre
Meta Debugger Available languages:
English.
FAQ
-
What about others talk about meta debugger chrome extension?
100% user give 5-star rating. Read reviews of meta debugger
-
How could i get help if there is something wrong with meta debugger chrome extension?
You could find more help information from meta debugger support page.
-
How could i contact the developer of meta debugger chrome extension?
You could send emails to publisher, or check publisher's website.
-
What are the required permissions for extensions?
- activeTab
- *://*/*
More about manifest_file of meta debugger.
-
How could i report abuse of meta debugger chrome extension?
You could click to report abuse of meta debugger.
Reviews of meta debugger:
François Rouault
March 26th, 2022

Awesome! The fact that it is integrated in the DevTools is absolutely perfect. Thank you