
What is UDO Debugger?
UDO Debugger is a developer tools chrome extension. it's a free extension , it has 3,000+ active users since released its first version, it earns an average rating of 4.18 from 11 rated user, last update is 1402 days ago.
What’s new in version 0.3.1?
This Chrome Extension will allow you to debug your Tealium setup. Easing the task of vieweing the current UDO data, and utag.link calls.
New in Version 0.3.1
Removed unused permissions.
Updated Tags Definitions
New in Version 0.3.0
- Tags List now show the state, Wait, Load, Send
- Tags List now show the latest tag update date
- Now all available tags are reported, only loaded are shown
- Total UTAG variables, links, views, tags reported on top of pages
- window.utag_data is reported on page load.
Fixes
- Improved Tealium IQ detection routines, to being able to catch all calls
- Fixed Enviroment Switcher on URLs with hashtags
- Copy to clipboard fixed now it works without needing a double click
- Lots of more small stuff =)
New in Version 0.2.2
Enviroment Switcher needs cookie access for the main_frame. Permissions restored. Tested with a wrong manifest on 0.2.1 version ;/
New in Version 0.2.1
Fixed Permissions to be activeTab only
New in Version 0.2.0
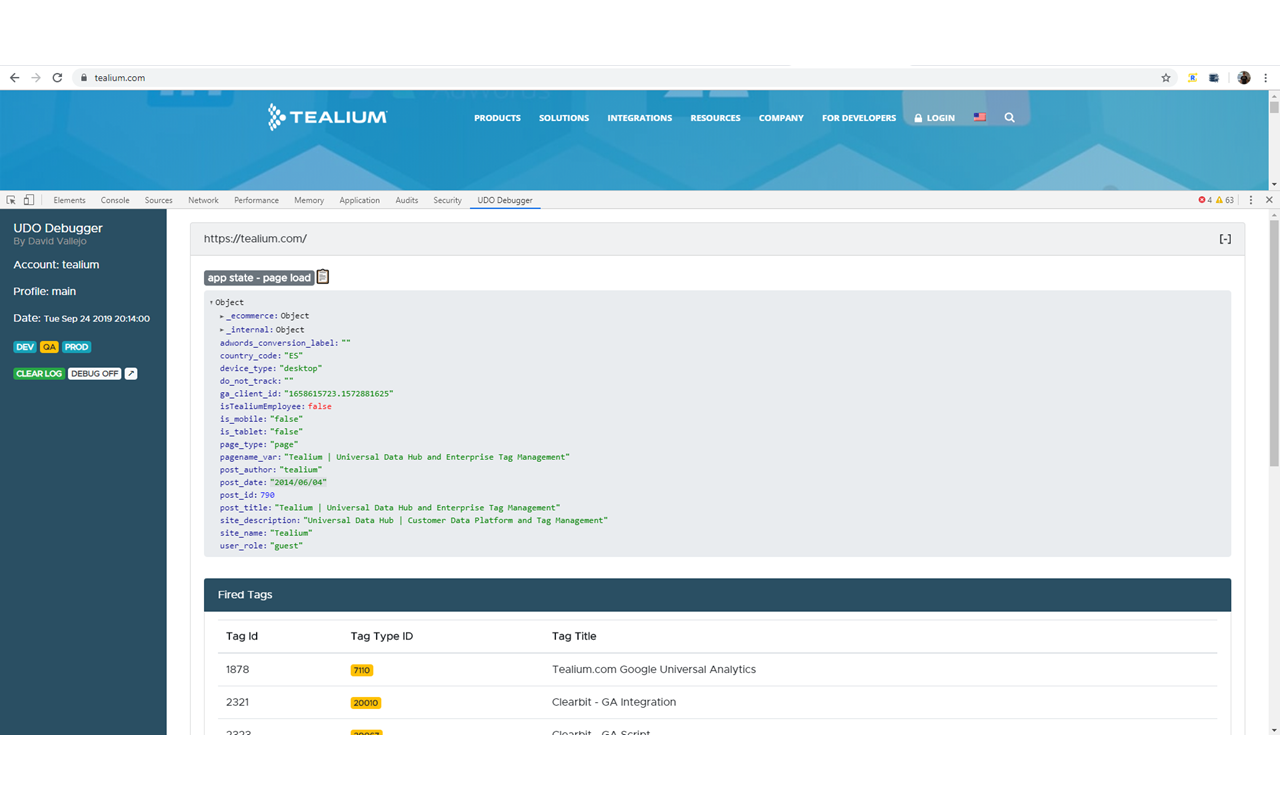
NEW. App State, Utag.link, utag.view Reporting
NEW. The current fired tags are reported.
NEW. Clipboard Support.
NEW. Environments Switcher
NEW. Debug Enabler / Reporter
All details at: https://www.thyngster.com/udo-debugger-easiest-way-to-work-and-qa-tealium-implementations/
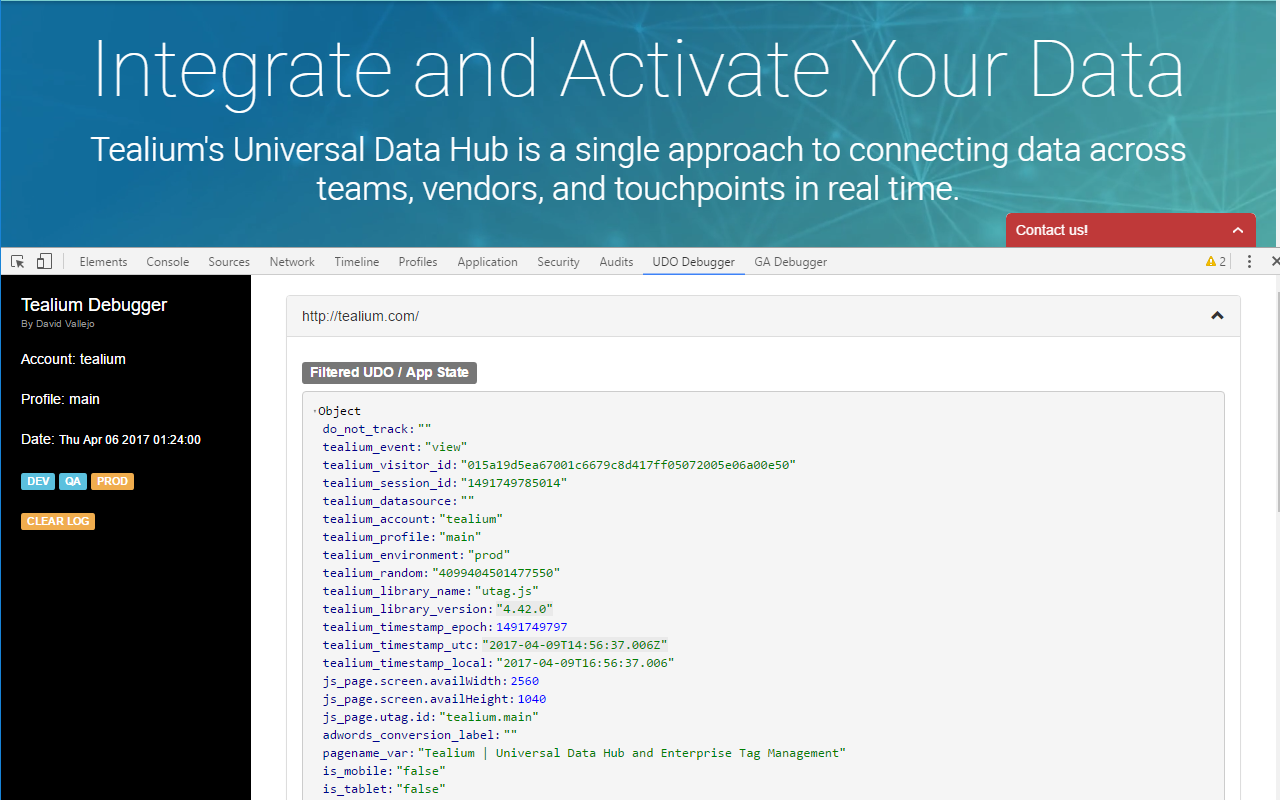
In the current version the extension is able to provide the following info:
* The account name
* The profile name
* The enviroment
* Filtered Page App State (not including internal Tealium's utag_data variables)
* View utag.link calls in real time
* Loaded tags overview (Beta)
* Keep a log of current navigation historial along with all Tealium related data.
Steps to use this extension:
1. Open the Chrome Developers Tool:
Windows and Linux: Control-Shift-J (or F12 key)
MacOs: Command-Option-J.
2. Click on the Tealium Debugger Tab
3. If it's necessary Refresh the current page.
Changelog:
0.1.3:
- Extension Name change due to trademark complaint
- Improved code, now it shows info faster
- Added compatibility for some specific implementation setup types
0.1.1:
- Bug fixes
- Added Fired Pixels Beta
0.1.0:
- First Public Version
* Disclaimer: This extension is not related in any way to Tealium company. It's sole product from an individual with any kind of relationship with the key company.
How to install UDO Debugger?
You could download the latest version crx file or older version files and install it.
Preview of UDO Debugger

Technical Features:
- Latest Version: 0.3.1
- Requirements: Windows Chrome, Mac Chrome
- License: Free
- Latest update: Tuesday, June 30th, 2020
- Author: David Vallejo
UDO Debugger Available languages:
English.
FAQ
-
What about others talk about udo debugger chrome extension?
100% user give 5-star rating. Read reviews of udo debugger
-
How could i get help if there is something wrong with udo debugger chrome extension?
You could find more help information from udo debugger support page.
-
How could i contact the developer of udo debugger chrome extension?
You could send emails to publisher, or check publisher's website.
-
What are the required permissions for extensions?
- cookies
- webRequest
- webRequestBlocking
- <all_urls>
More about manifest_file of udo debugger.
-
How could i report abuse of udo debugger chrome extension?
You could click to report abuse of udo debugger.
Reviews of udo debugger:

So glad I found this. If you have many sites with different profiles, this is a must have.

I wish I'd had this plugin the years I spent using Tealium tag manager on a daily basis for enterprise size websites. Now it's an essential one in my debugging tool set.