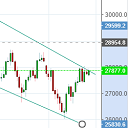
Stock Chart provide Technical Charts Analysis for forecasting stock, index of future price. Stock Chart 提供技術圖表分析工具,協助用家以估計股票或指數未來趨勢。
What is Stock Chart?
Stock Chart is a accessibility chrome extension. it's a free extension and is featured in Accessibility, it has 581 active users since released its first version, it earns an average rating of 4.50 from 6 rated user, last update is 2044 days ago.
What’s new in version 1.0?
                Real time Stock/Future/Index Technical Charts Analysis.
即時股票/期貨/指數的技術圖表分析工具

Function:
Drawing Tools
Real time price
Take Photo for your Chart
News of the Stock

功能:
畫圖工具
即時價位
輸出畫圖後的圖表
股票新聞

即月期 代號 HK50
HSI 代號 HONG KONG:HK50
港股搜尋格式:(XXXX) e.g. 0700
因圖表是由Investing.com輸出,有些港股未能顯示出來
可以在 左上角Search

This Chrome Extension are Copyright © 2018 by [email protected]
Technical charts are powered by Investing.com & TradingView
How to install Stock Chart?
You could download the latest version crx file or older version files and install it.
Preview of Stock Chart


Technical Features:
- Latest Version: 1.0
- Requirements: Windows Chrome, Mac Chrome
- License: Free
- Latest update: Monday, October 1st, 2018
- Author: lok960821
Stock Chart Available languages:
English.
FAQ
-
What about others talk about stock chart chrome extension?
67% user give 5-star rating, 33% user give 2-star rating. Read reviews of stock chart
-
How could i get help if there is something wrong with stock chart chrome extension?
You could find more help information from stock chart support page.
-
How could i contact the developer of stock chart chrome extension?
You could send emails to publisher, or check publisher's website.
-
How could i report abuse of stock chart chrome extension?
You could click to report abuse of stock chart.
Reviews of stock chart:
Ingo Dödel
September 29th, 2021

Absolut brauchbar . Gute Candlestick Charts
Wing Lau
October 1st, 2018
很多股票(港股)入不到,例如: 匯豐銀行0005;
Simon Lau
October 1st, 2018

very useful and great tools, thanks PoolestDeveloper!